Power BI dashboards
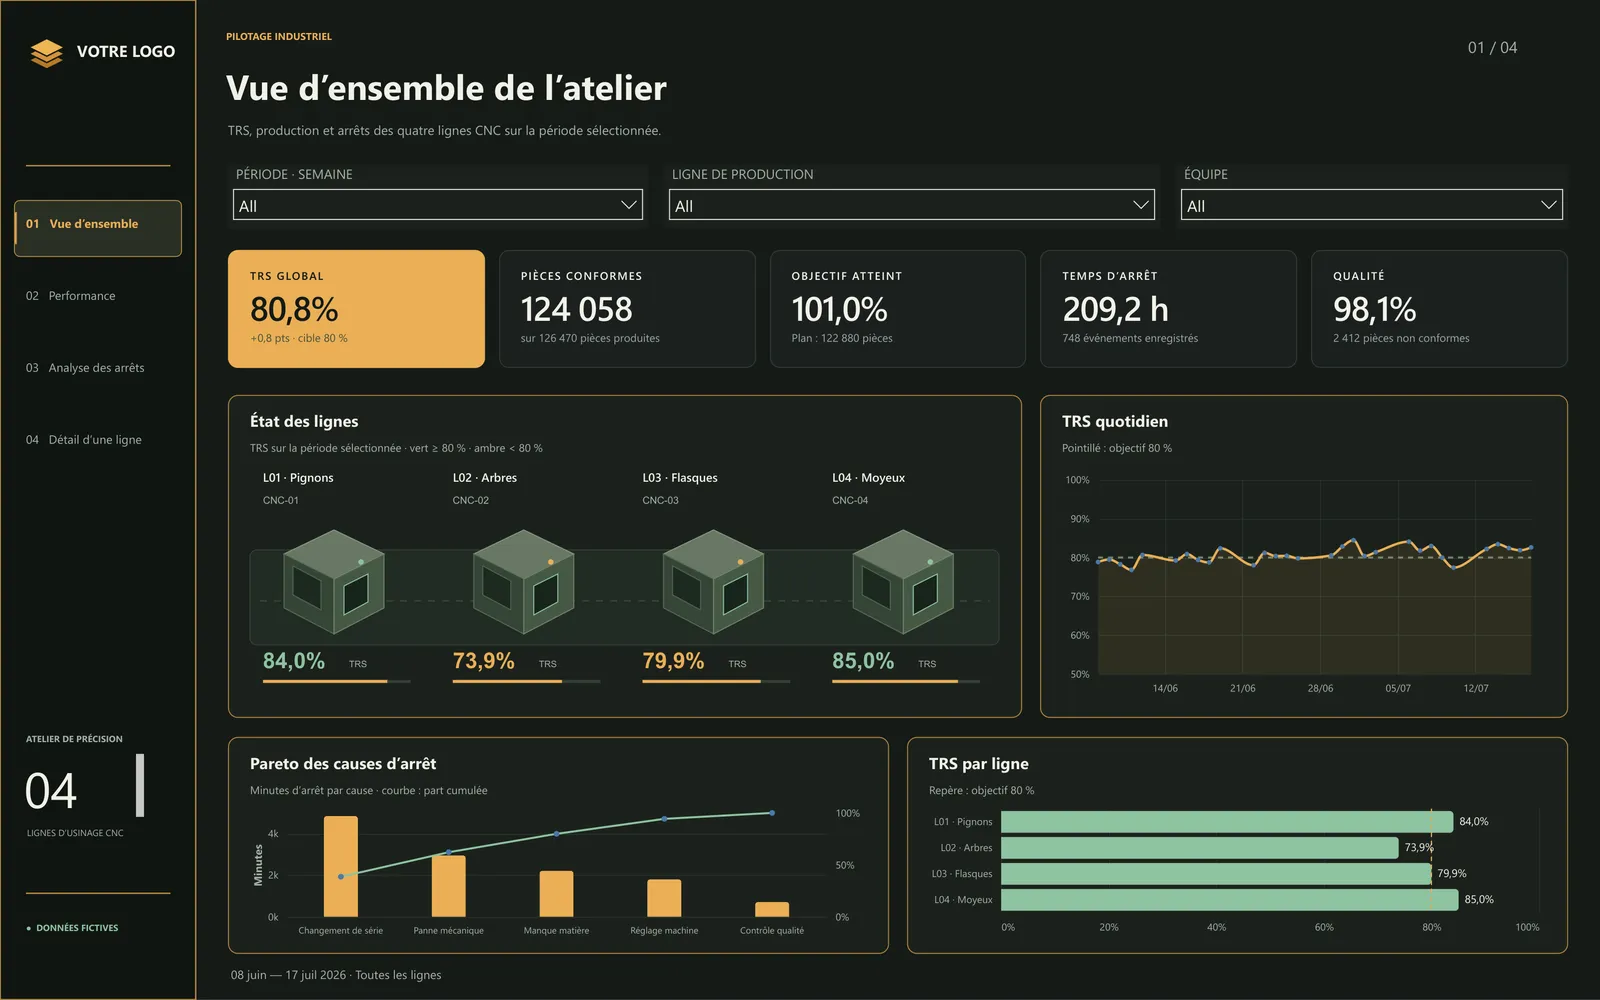
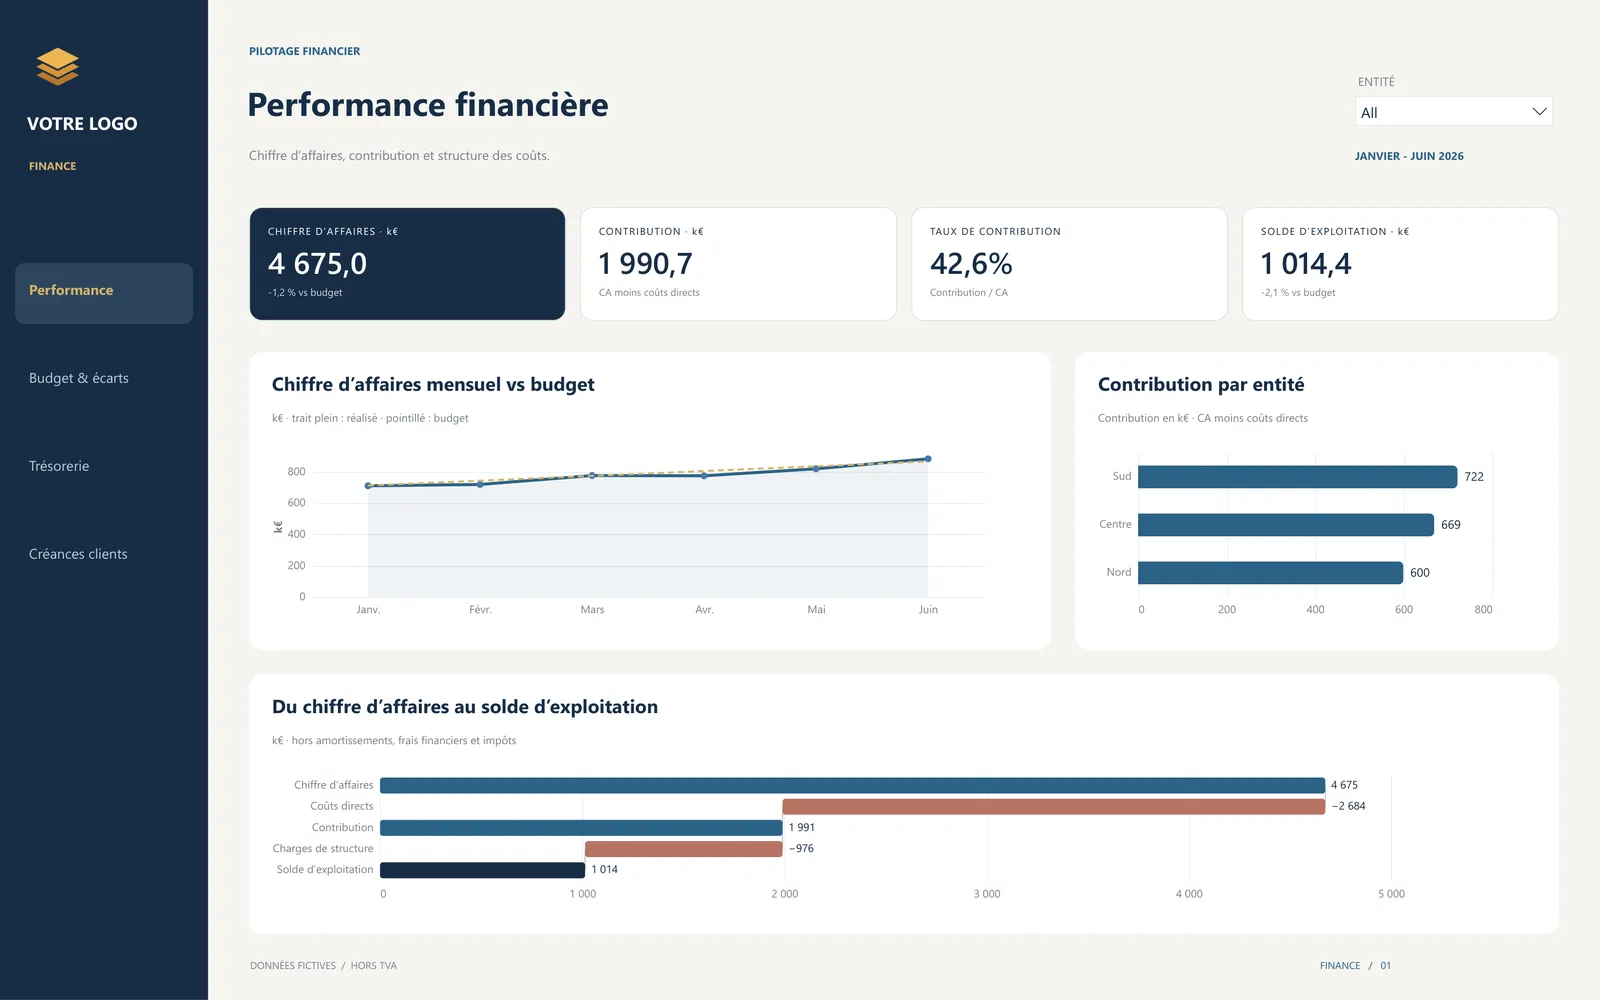
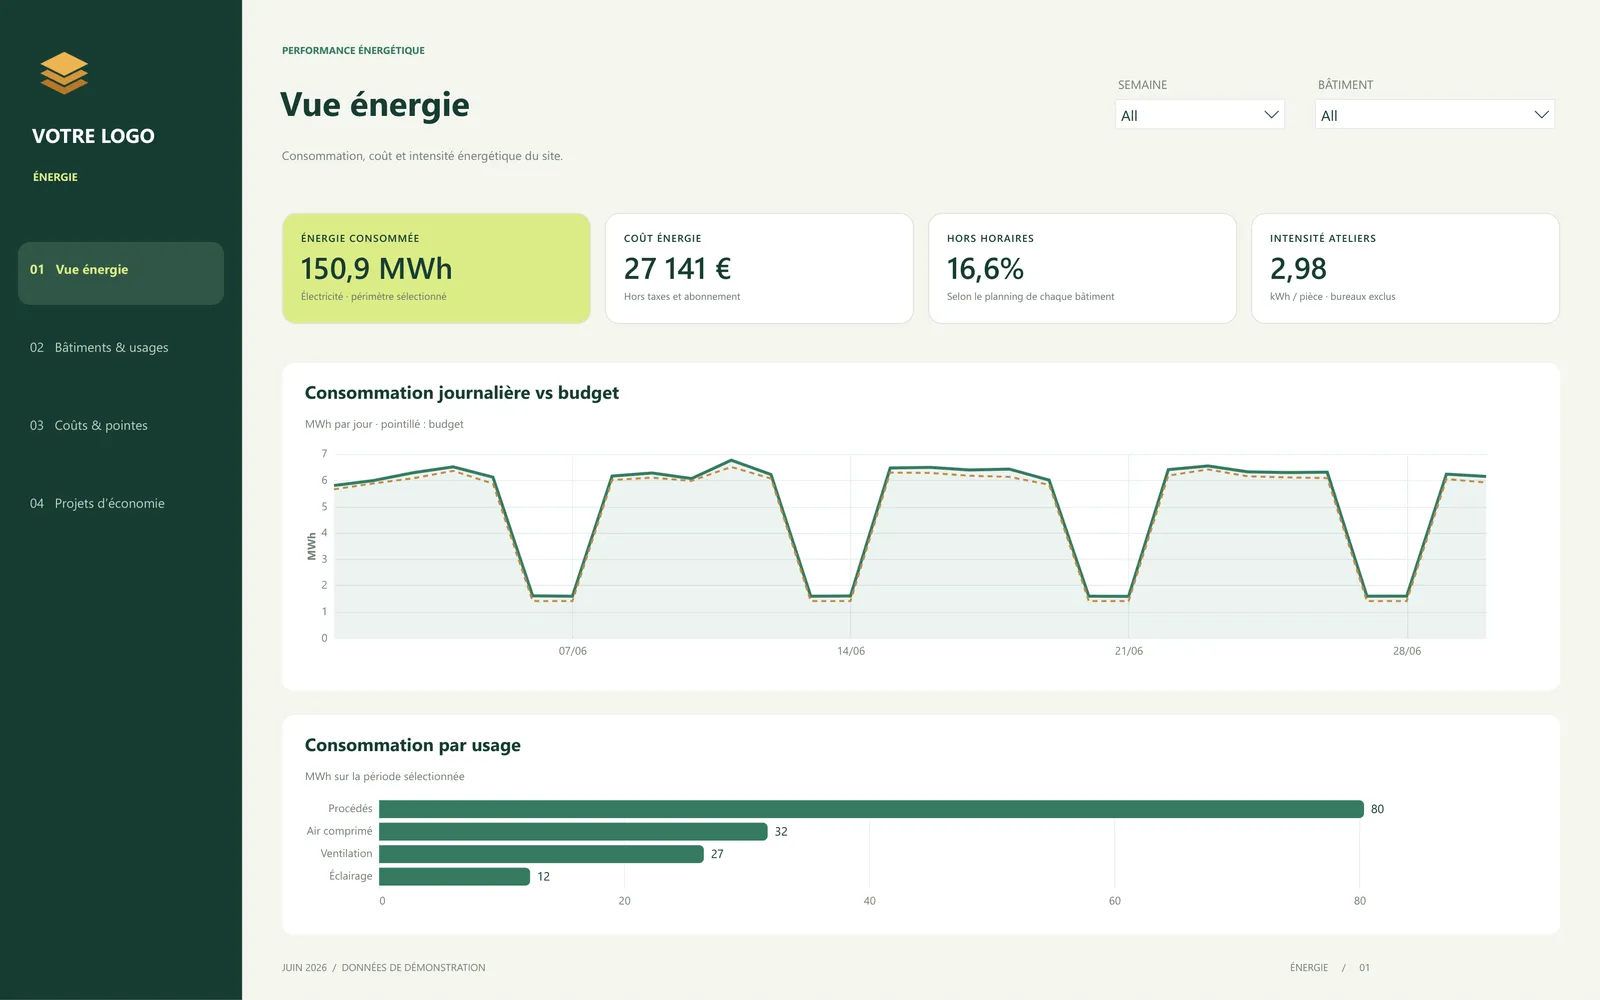
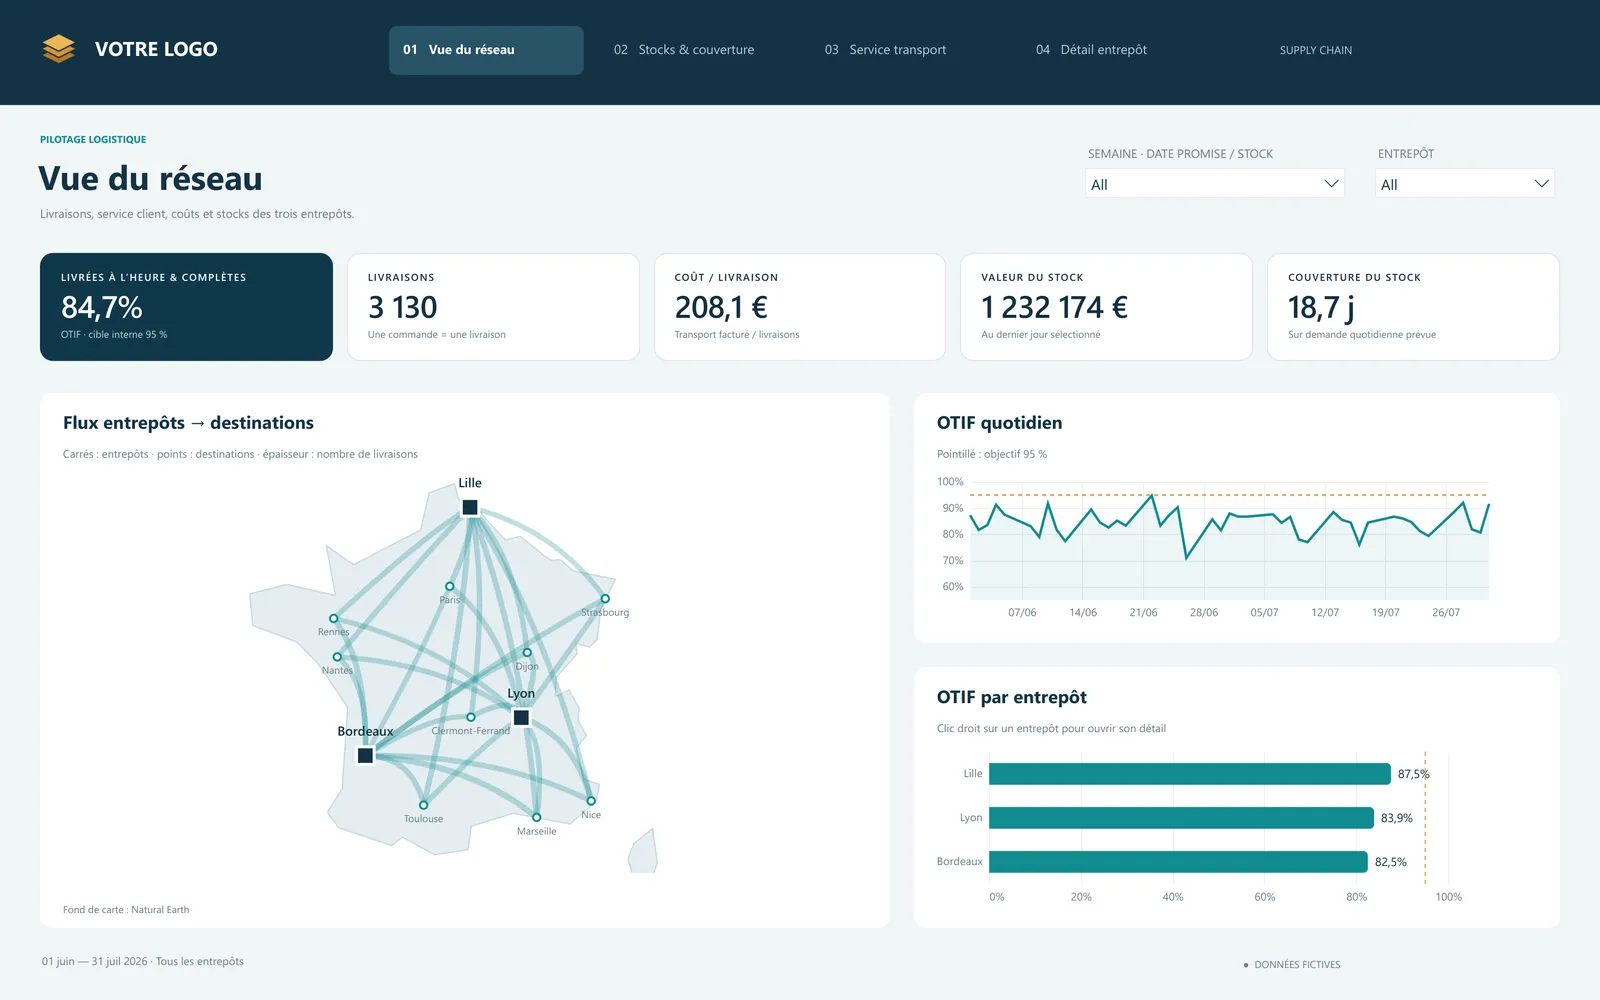
Eight Power BI reports, one for each business area, on fictional data.
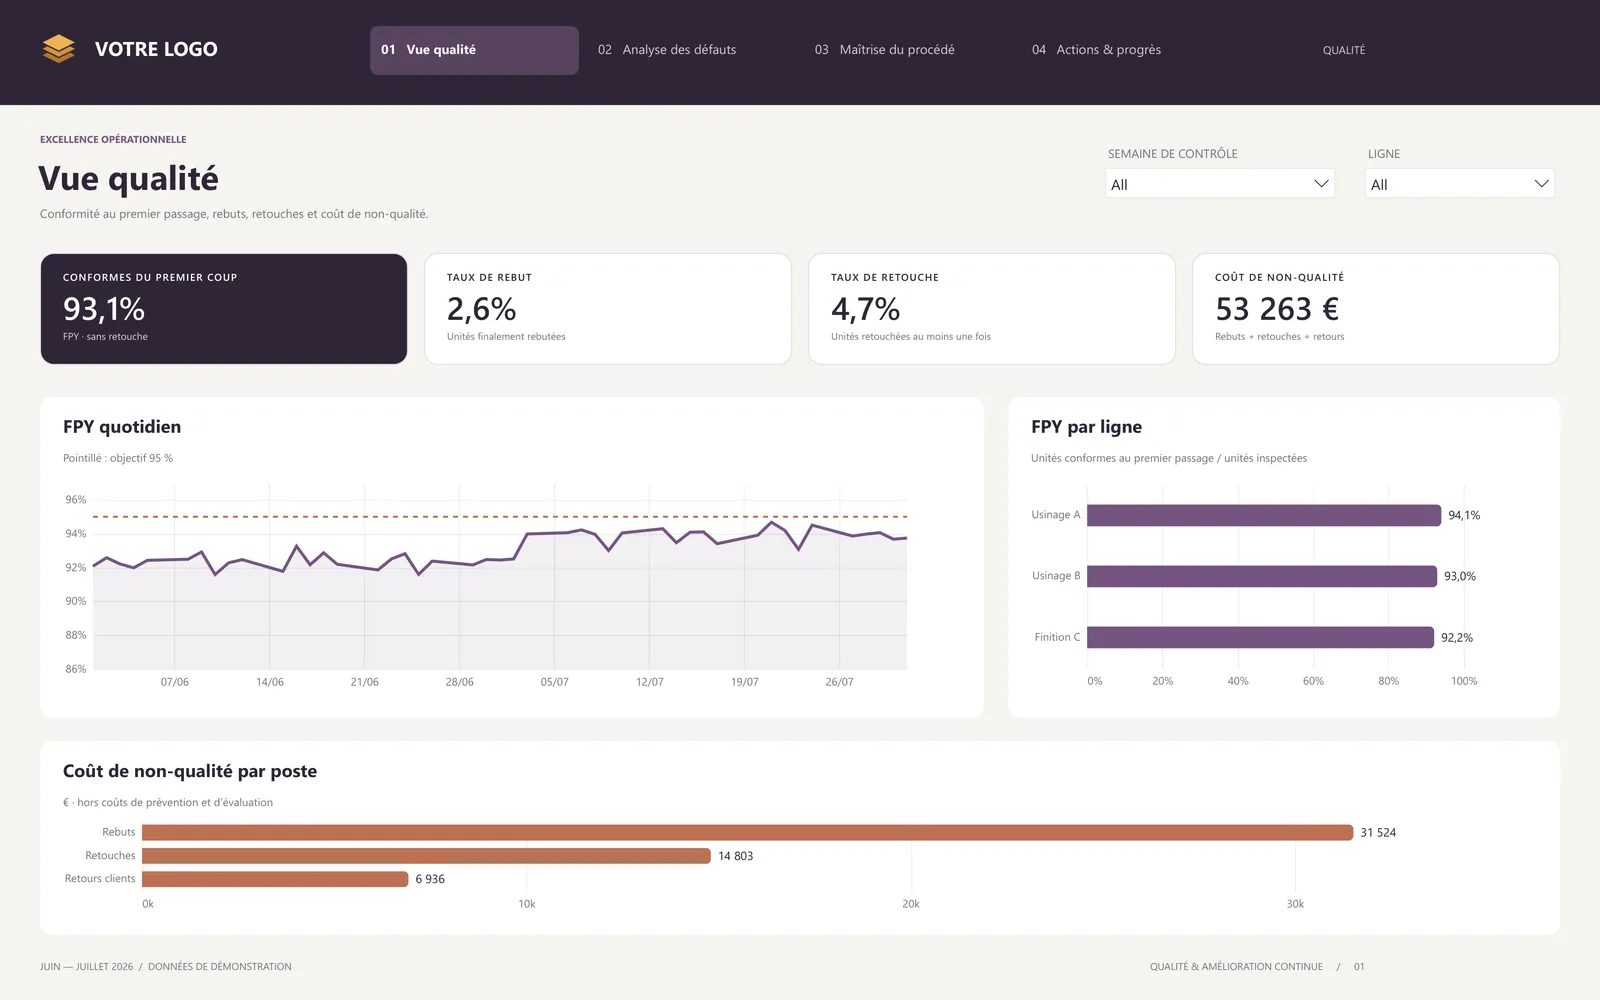
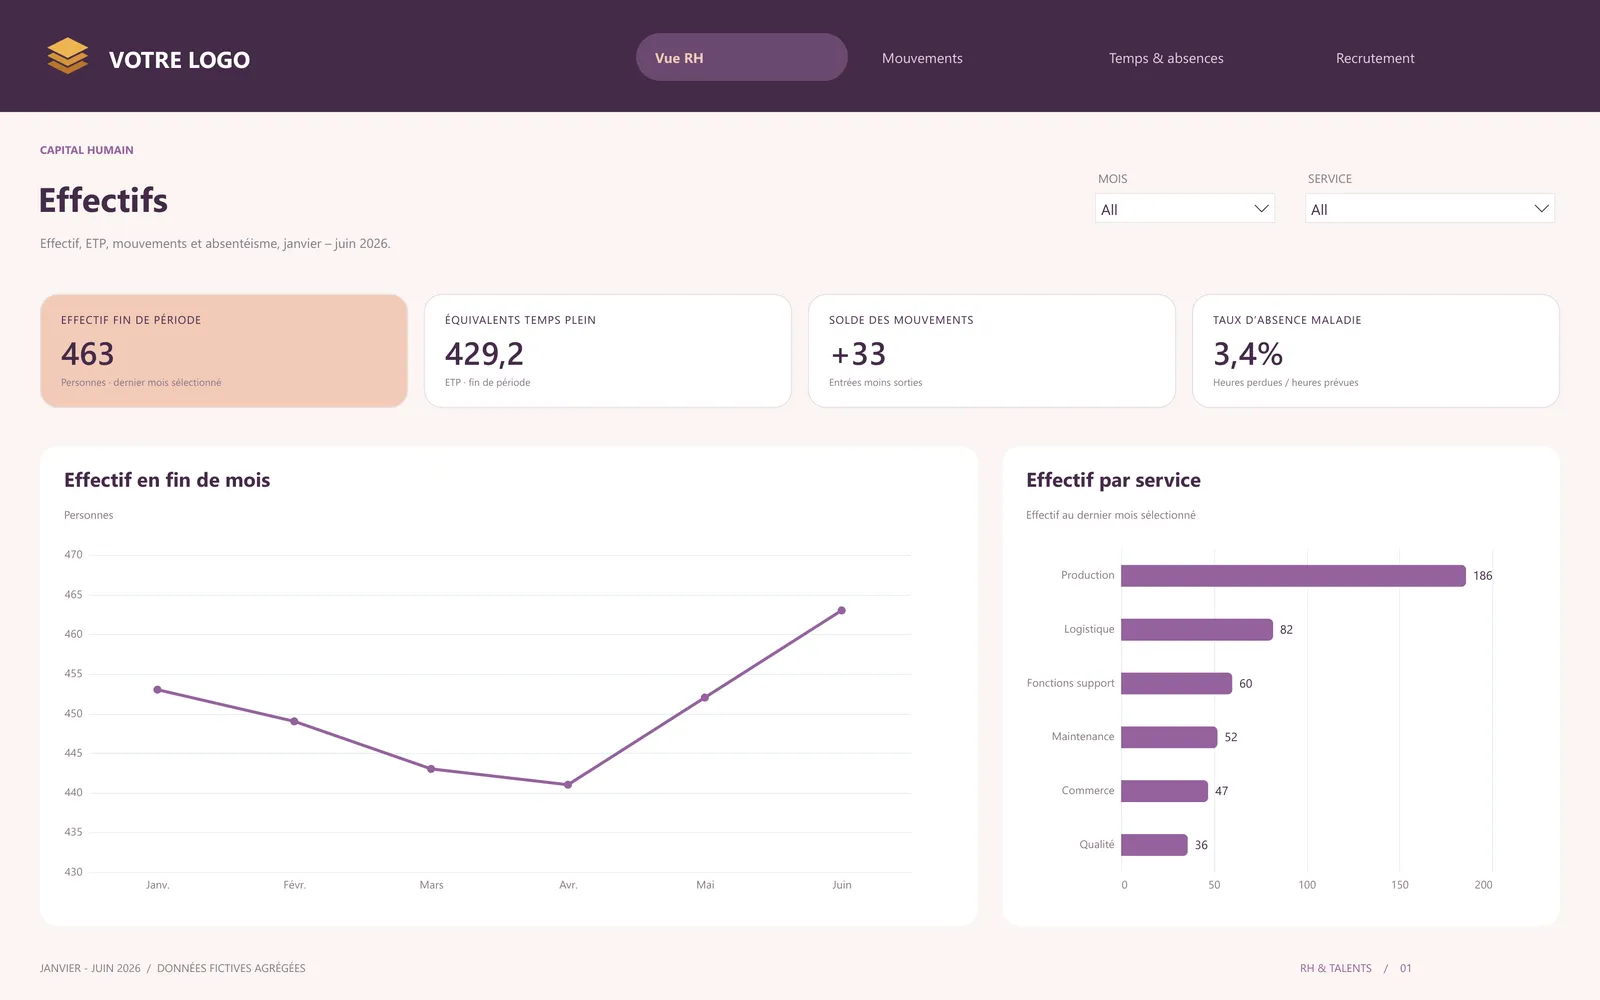
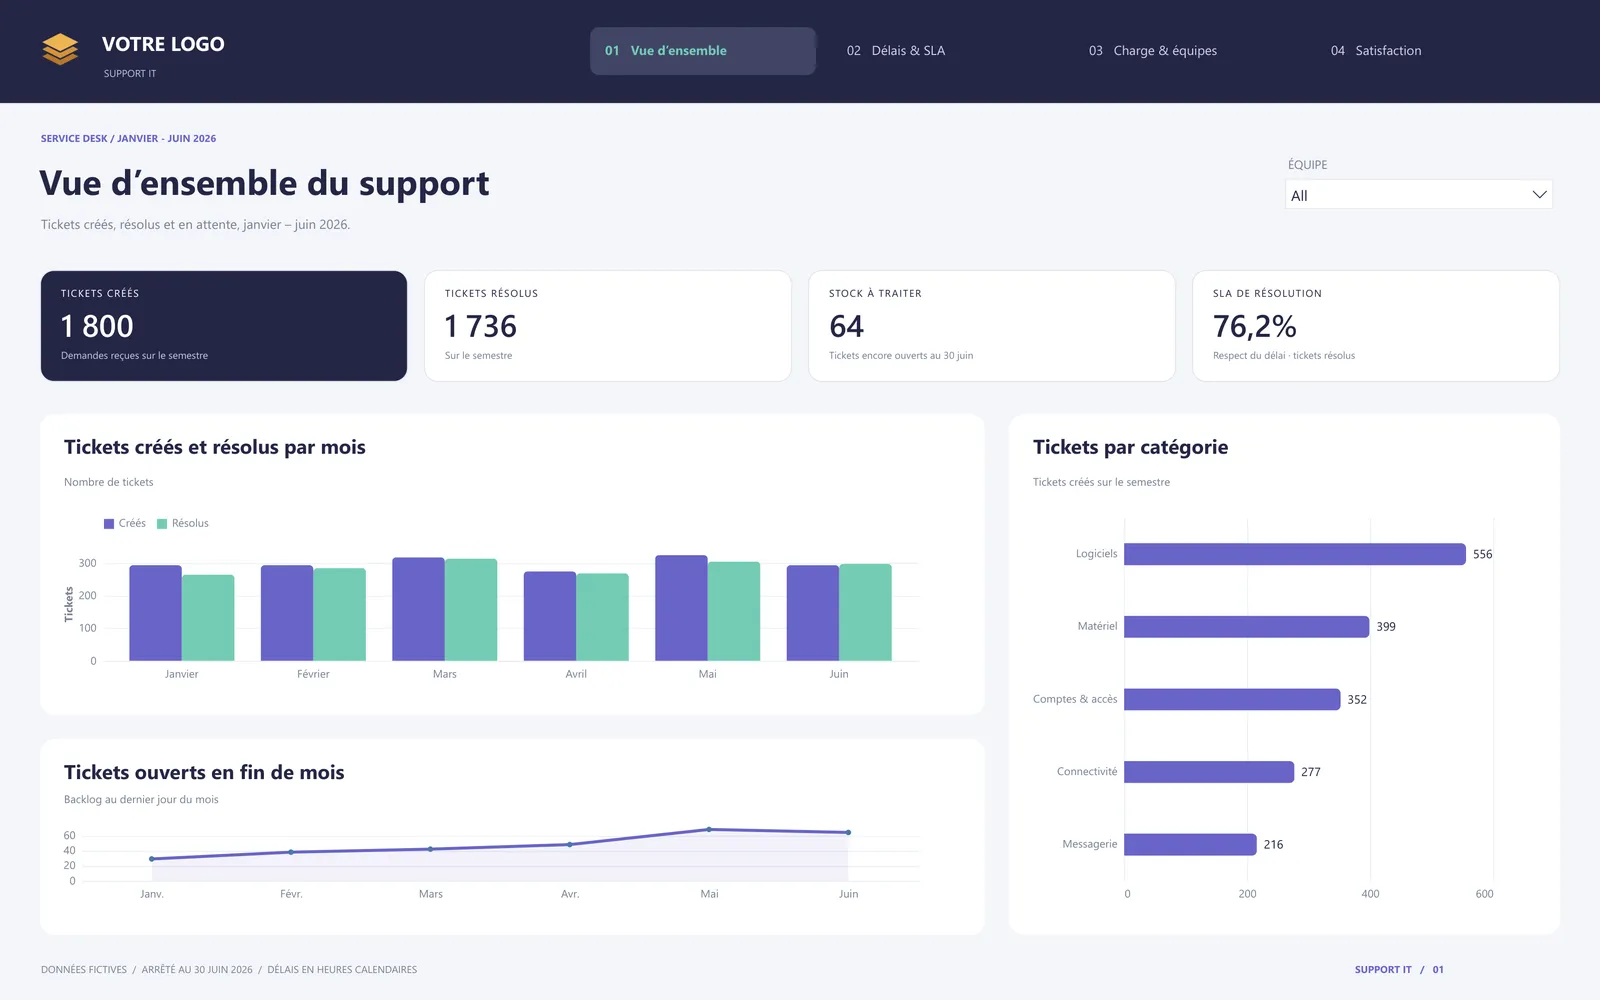
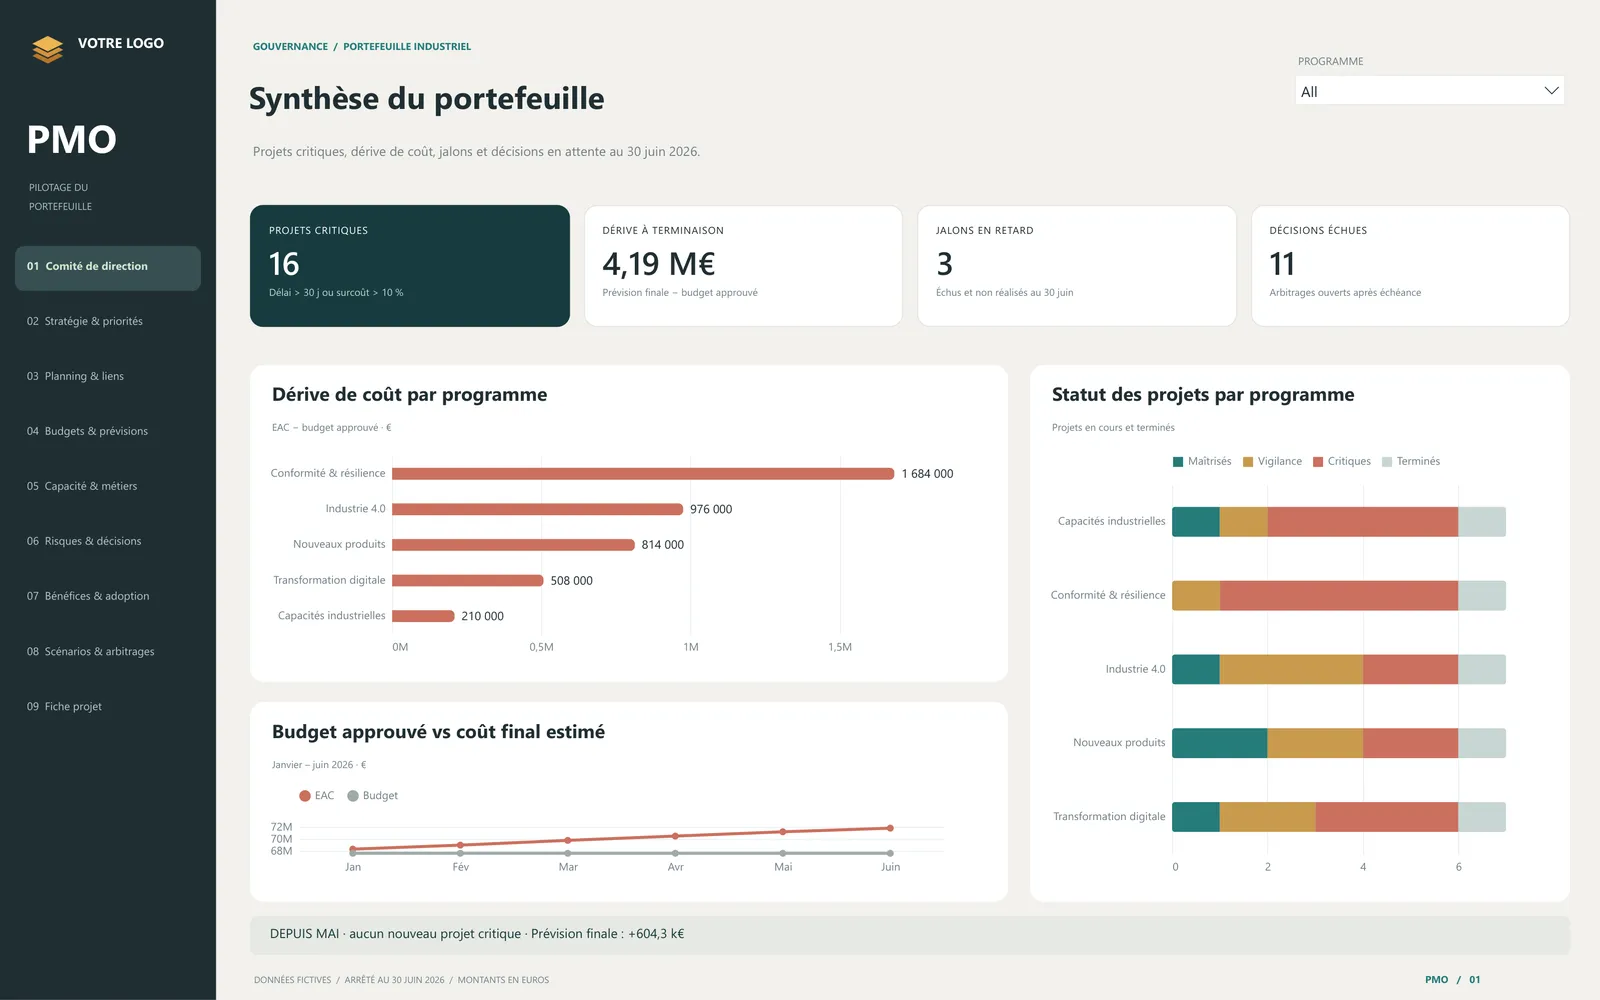
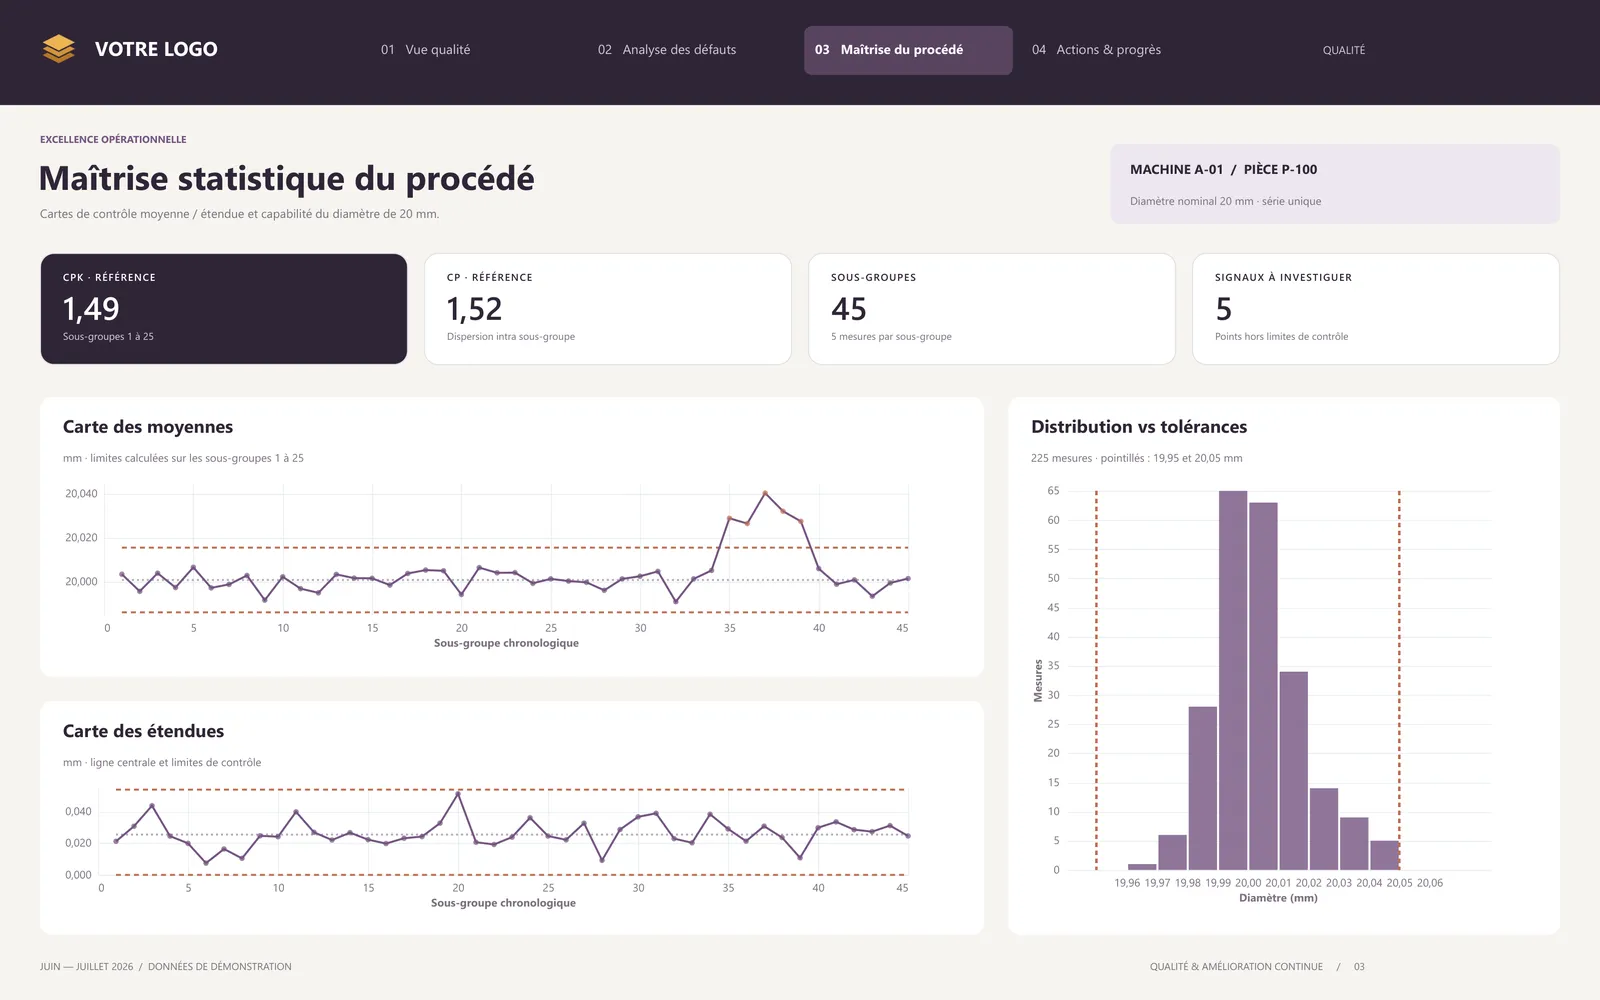
Industry, finance, energy, logistics, quality, HR, IT support and PMO: each report tracks the indicators of its area, from OEE and OTIF to control charts and earned value.
Each report is a single .pbix file with its data inside, so it opens offline in Power BI Desktop. To plug in real data, point each Power Query source at an Excel file, a CSV or a database and keep the same columns.
At a glance
- Reports
- Industry, finance, energy, logistics, quality, HR, IT support, PMO
- Pages
- 37, with detail pages for a production line, a warehouse and a project
- DAX
- 308 measures
- Charts
- 102 Deneb (Vega-Lite) visuals: bridges, Pareto, control charts, heatmap, funnel
- Format
- PBIP project (PBIR and TMDL), shipped as .pbix
- Data
- Fictional, generated for the demos; labels in French