Workshop tools
Two small Python apps for two shop-floor methods: OEE and time study.
Each one reads a CSV file or its sample data, then goes from the calculation to a decision: where to act first for OEE, how many operators for the time study.
The calculations are kept apart from the interface and covered by tests; both interfaces are in English and French. The examples on this page use the sample data that ships with each repository.
OEE dashboard
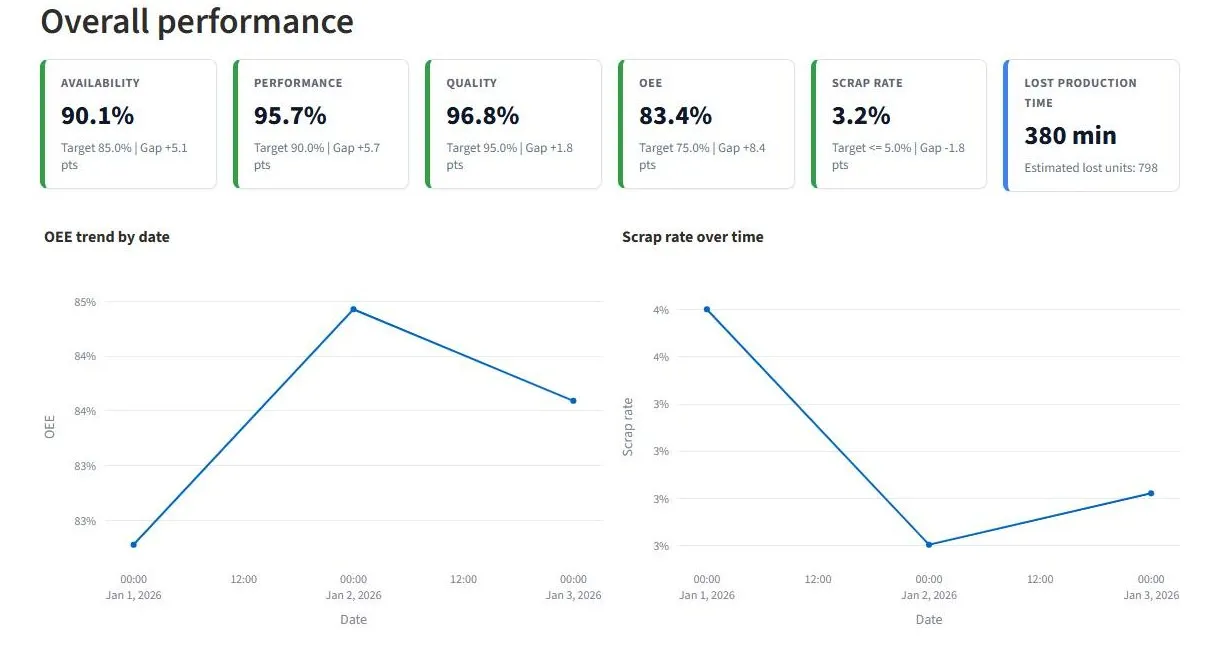
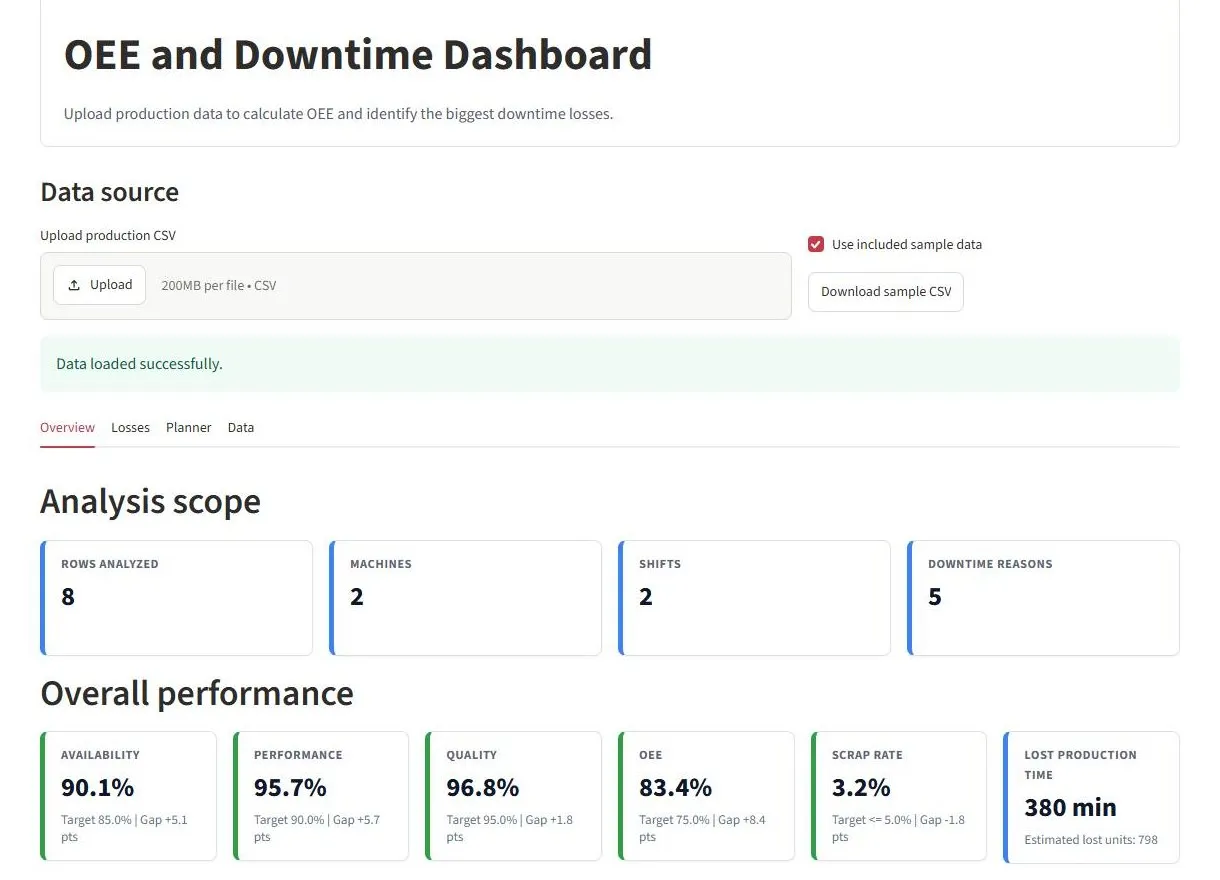
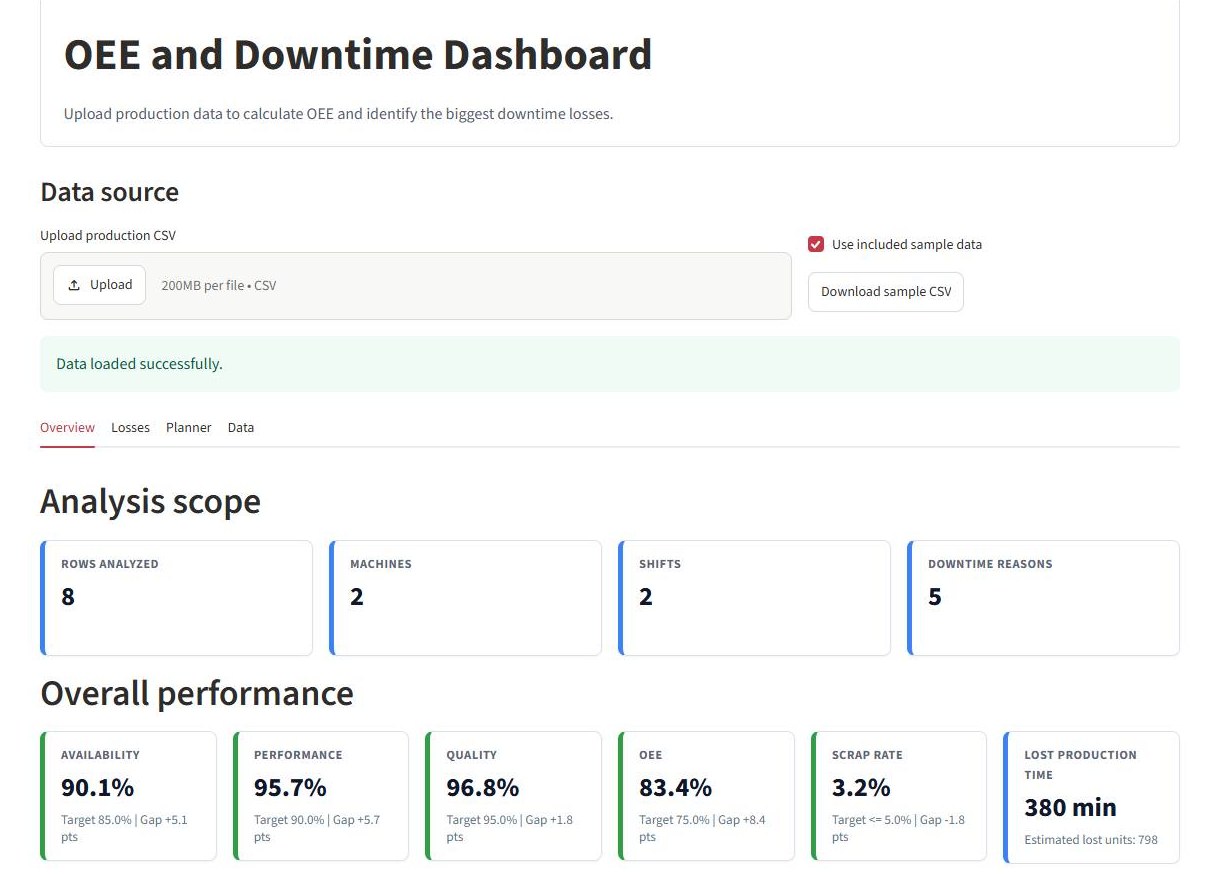
You load one CSV of production and downtime. The app checks the columns and values, then works out availability, performance, quality and OEE by machine, by shift and by day.
A downtime Pareto, adjustable targets and a downtime-reduction scenario help choose the first action; the filtered tables export to CSV.
1Load the production data
One CSV per workshop, or the sample data. Columns and values are checked before anything is worked out.
2Read the losses
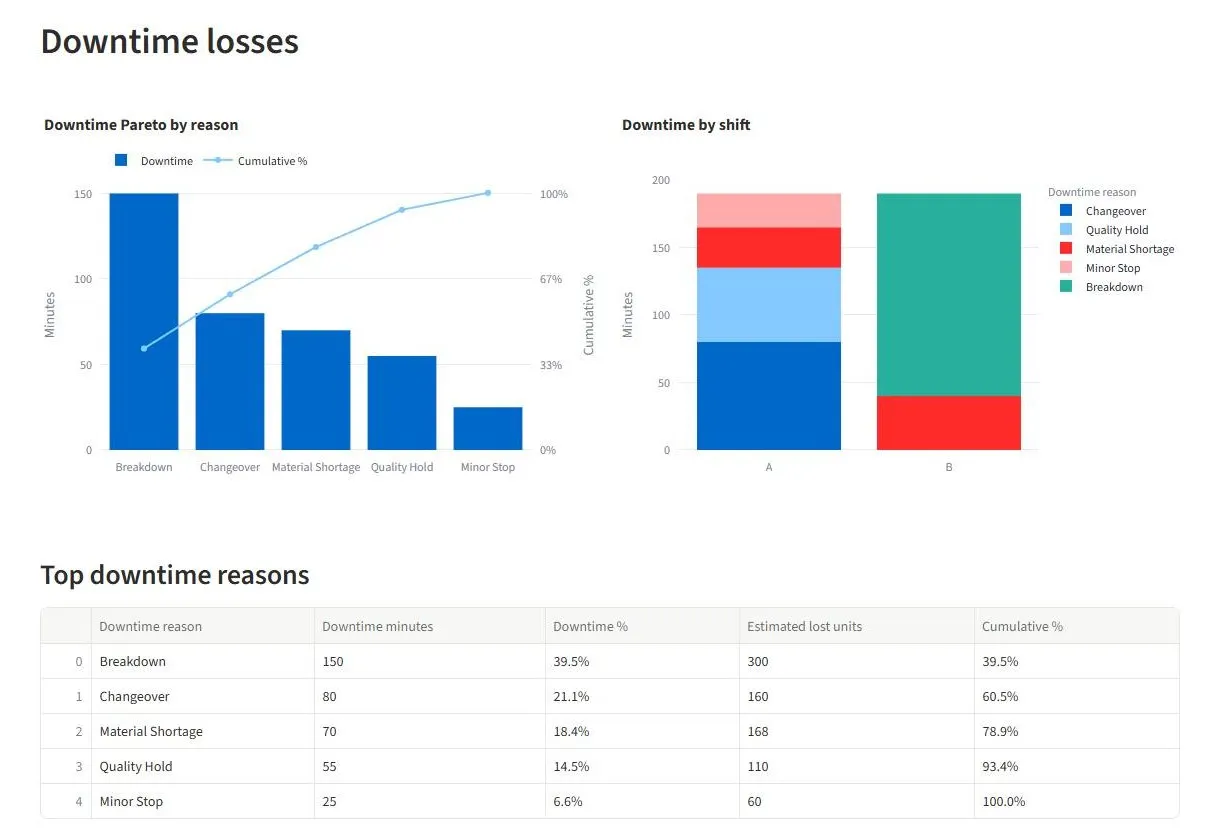
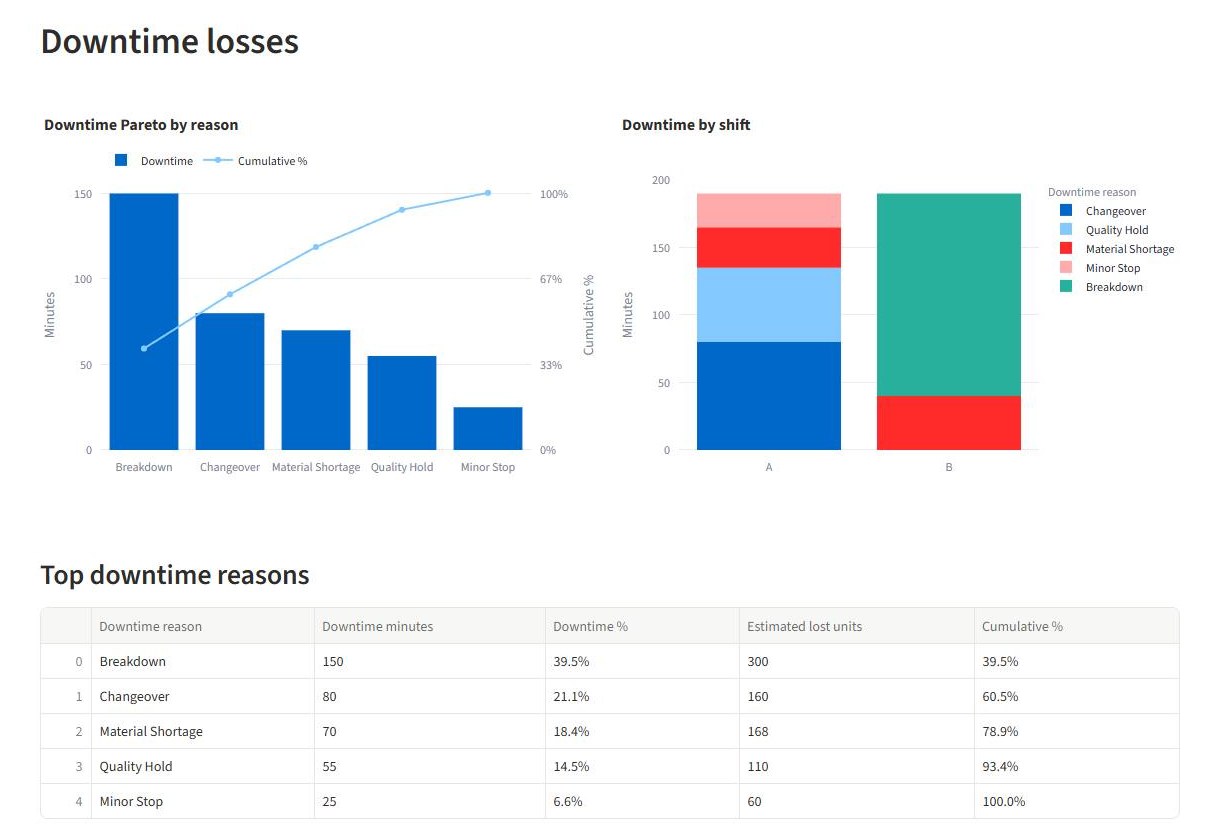
The downtime Pareto by reason and the split by shift: breakdowns are 39.5% of the sample’s downtime.
3Choose the action
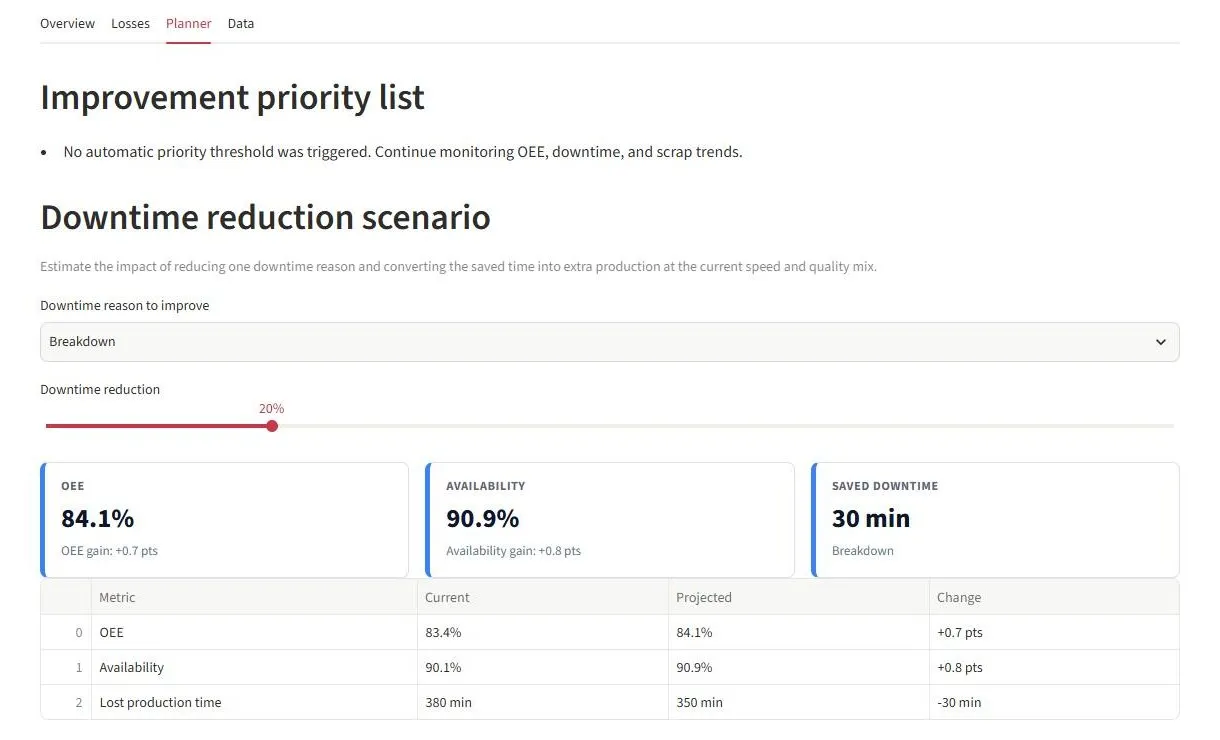
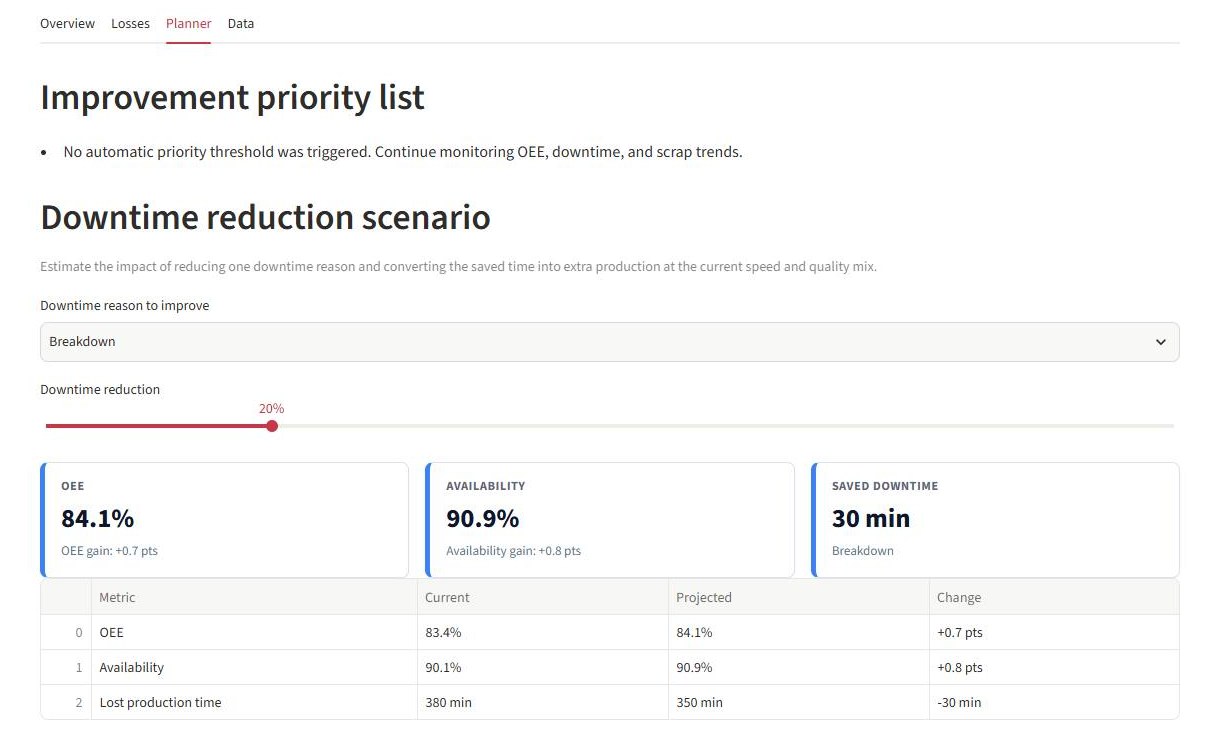
A scenario cuts one downtime reason and works the OEE out again: 20% fewer breakdowns take the sample from 83.4% to 84.1%.
Sample result
The sample data that ships with the app: 8 rows, 2 machines, 2 shifts, 3 days.
The formulas
- Availability
- Operating time ÷ planned time
- Performance
- Ideal cycle time × units produced ÷ operating time
- Quality
- Good units ÷ units produced
- OEE
- Availability × performance × quality
Where to act first
- Availability below 85%
- Cut downtime
- Performance below 90%
- Look for speed losses, micro-stops or a wrong ideal cycle time
- Quality below 95%
- Work on the causes of scrap and rework
- One reason above 40% of downtime
- Deal with it first
Time study
You enter the observed cycle times or load a CSV file. The app works out the normal time with the performance rating, then the standard time with allowances.
It then gives the capacity per operator, the takt time and the staff needed, flags outliers (the 1.5 × IQR rule) and estimates how many readings to take.
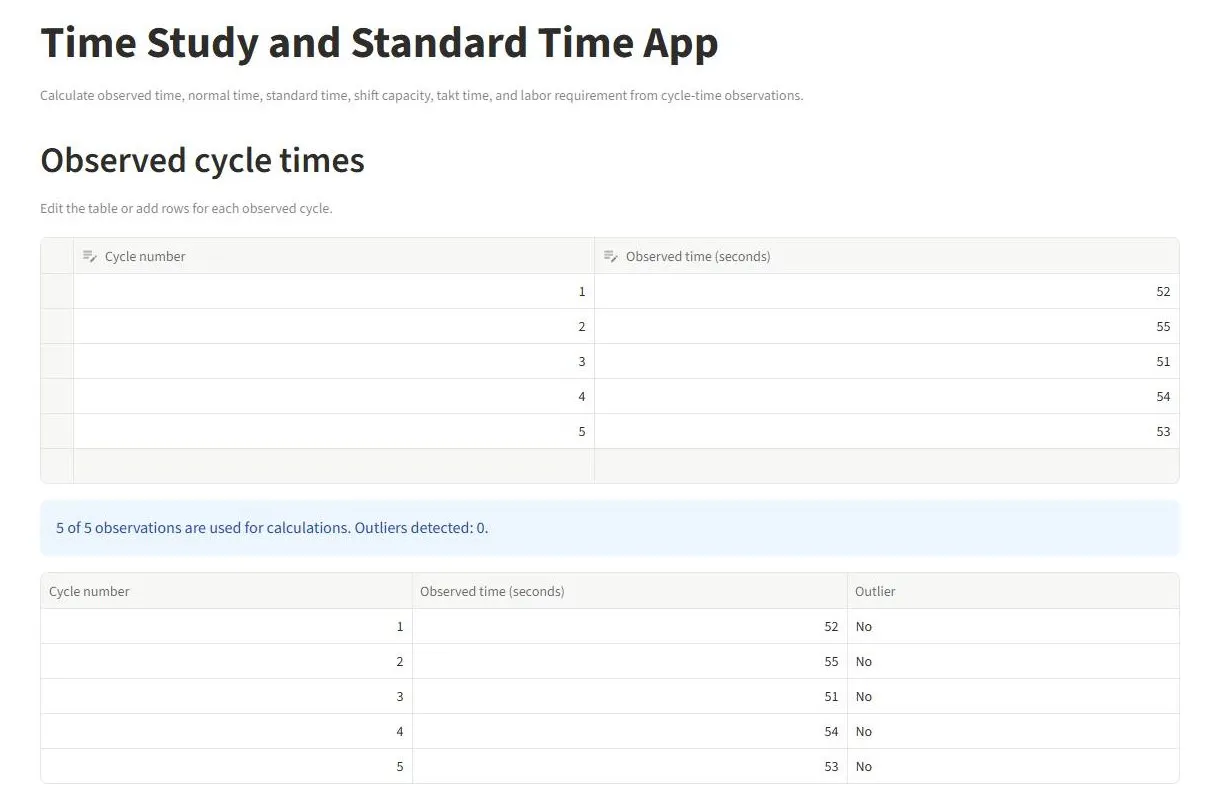
1Record the times
Cycles are typed into a table or loaded from a CSV; every outlier is flagged.
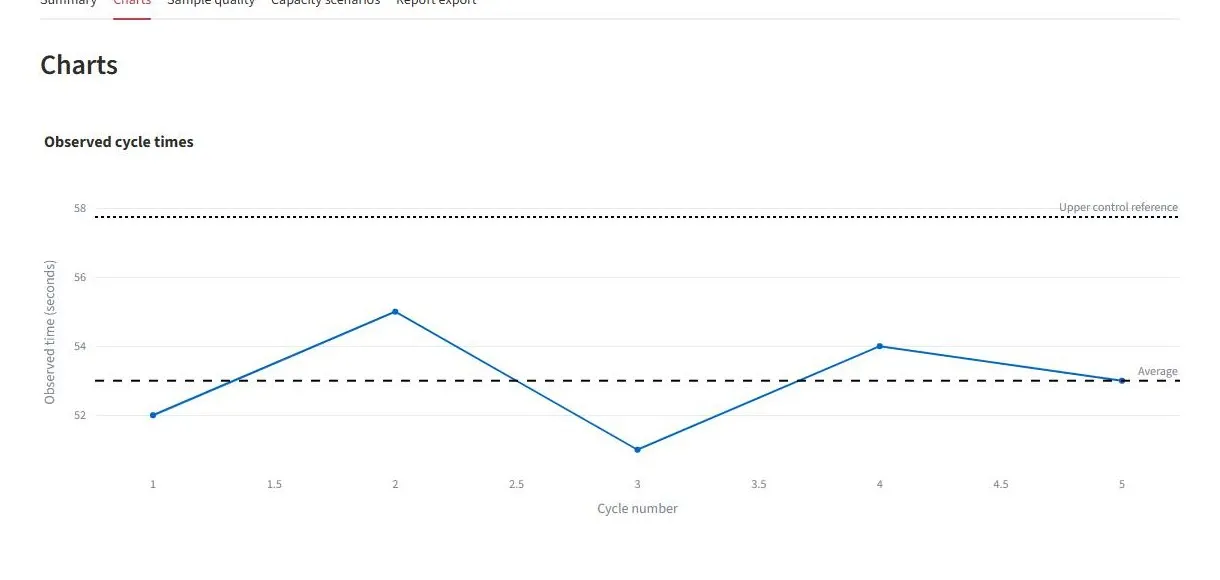
2See the variation
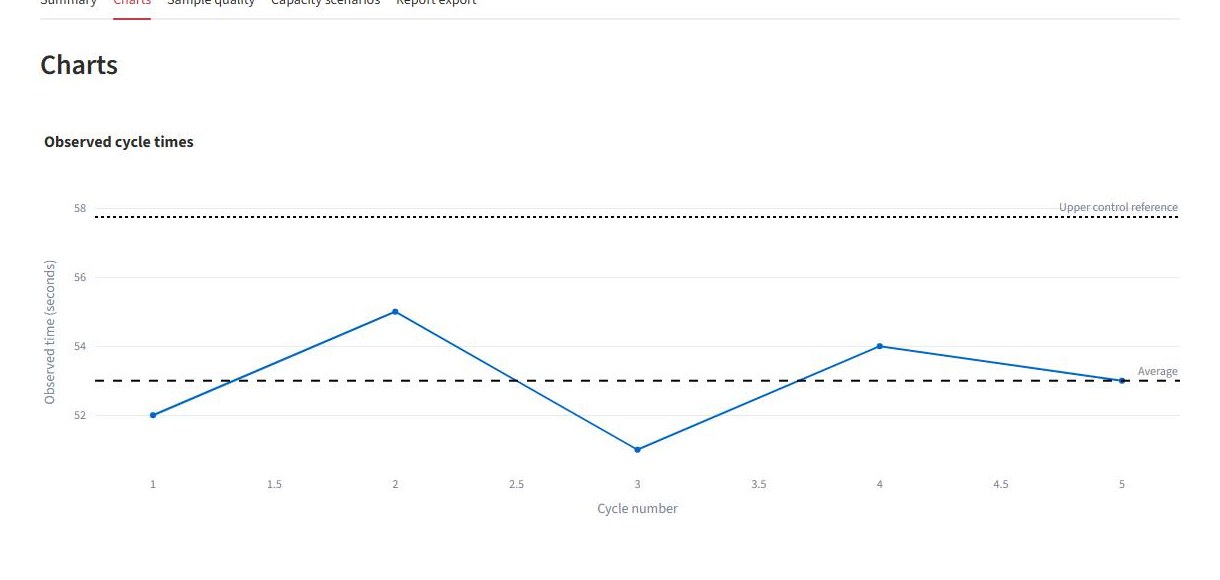
The readings against their mean, their distribution and their spread.
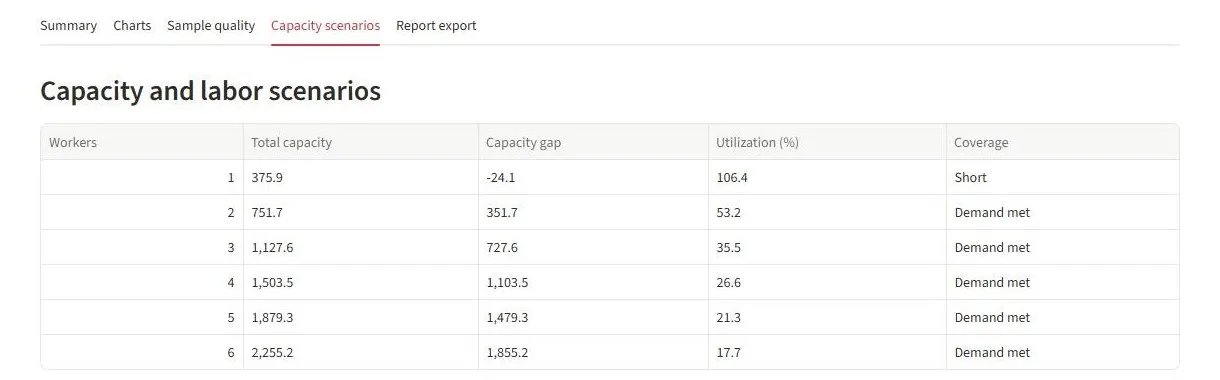
3Size the team
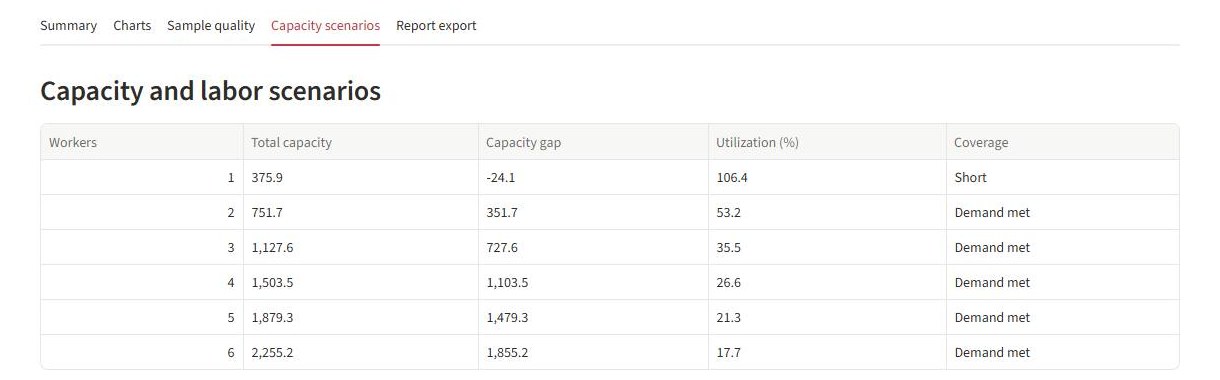
Capacity for one to six operators: with two, the demand of 400 units a day is covered.
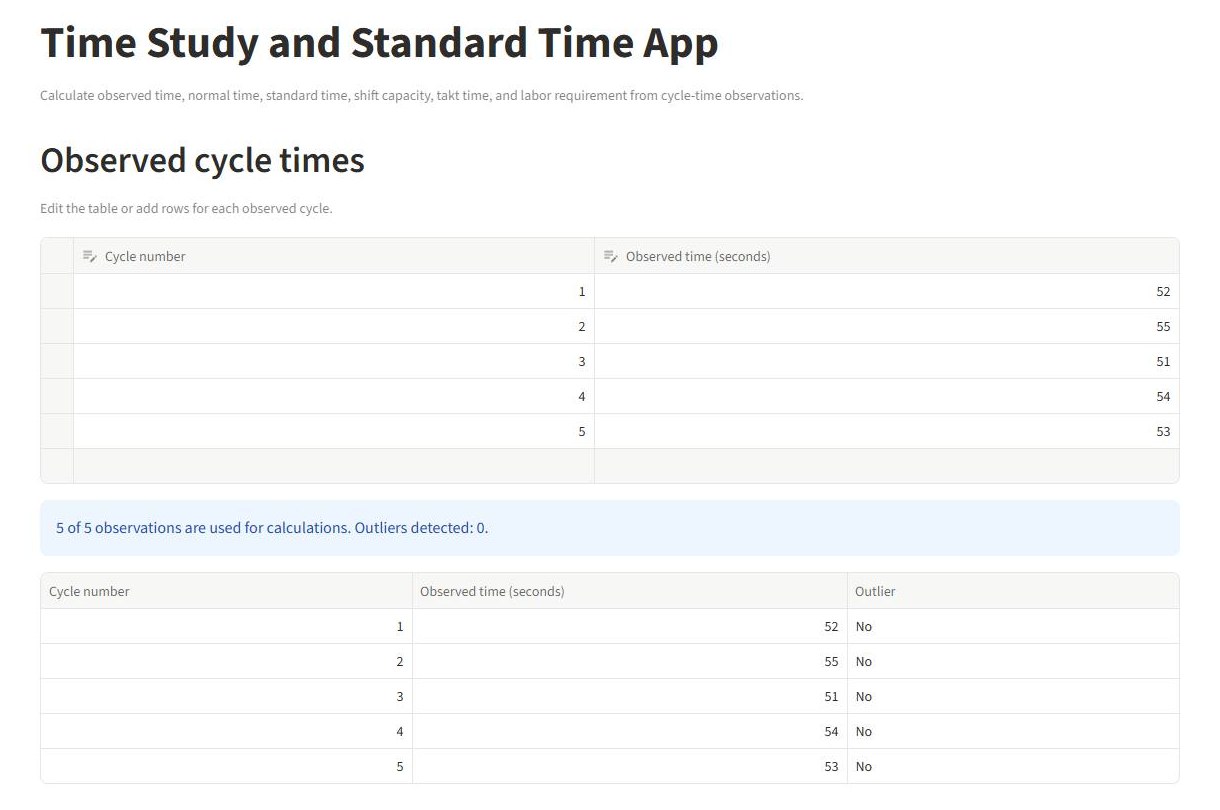
Sample result
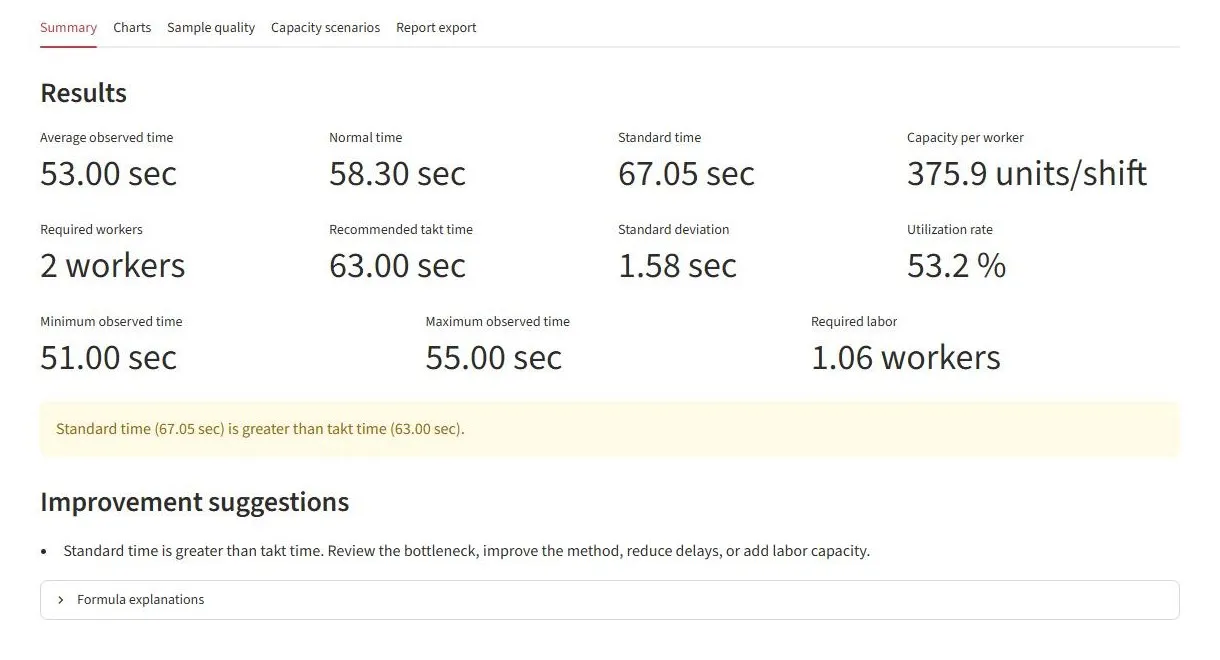
Five cycles observed: 52, 55, 51, 54 and 53 s. A 480 min shift, 60 min of breaks, 400 units a day.
- Mean observed time
- 53.00 s
- Rating
- 110%
- Normal time
- 58.30 s
- Allowances
- 15%
- Standard time
- 67.05 s
- Capacity per operator
- 375 units per shift
- Takt time
- 63.00 s
- Staff
- 2 operators (1.06 worked out)
The formulas
- Normal time
- Mean observed time × rating
- Standard time
- Normal time × (1 + allowances)
- Capacity
- Available time ÷ standard time
- Staff
- Demand × standard time ÷ available time
- Takt time
- Available time ÷ daily demand